
Loading article
Loading page...
Think of Amazon Brand Analytics as your brand’s own private eye inside the Amazon ecosystem. It’s a tool that gives you a direct look at your customer’s shopping journey, showing you the exact search terms they used and which products they ended up buying. Best of all, it's free for any seller enrolled in Brand Registry.
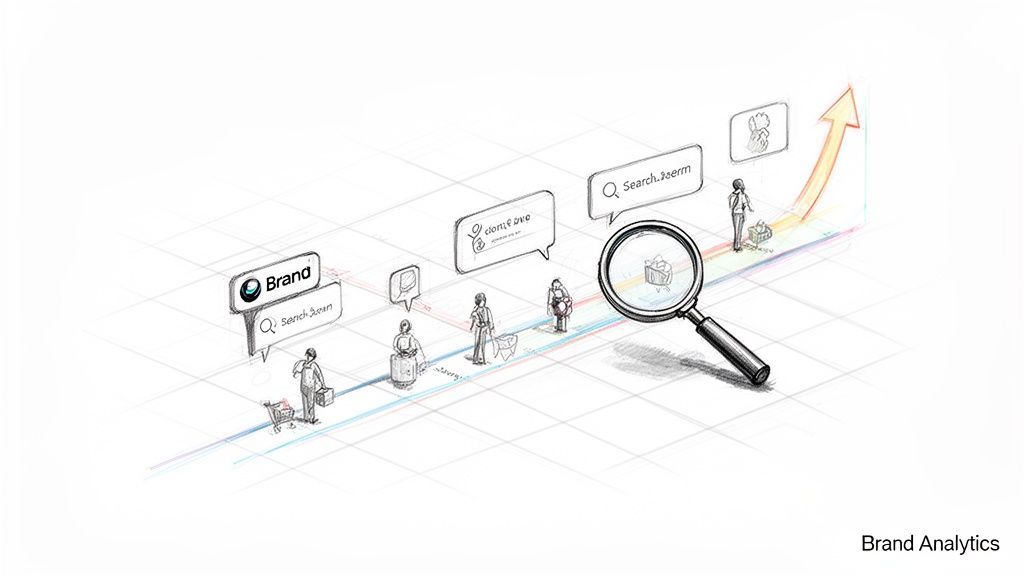
While your regular sales reports tell you what you sold, Amazon Brand Analytics (ABA) is what tells you the why. Instead of patching together insights from third-party tools or just plain guessing, ABA gives you access to Amazon’s own first-party data. This is aggregated, anonymized information on how millions of shoppers are searching, discovering, and purchasing products across the marketplace.
It’s like the difference between knowing your final destination and having a live traffic map to get there. Standard reports show your sales figures, which is great, but ABA reveals the most efficient routes to growth by highlighting keyword opportunities, competitor weaknesses, and hidden customer buying patterns.
Access to Amazon Brand Analytics is one of the biggest perks of joining the Amazon Brand Registry program. You absolutely must have a registered and active trademark to get in. This isn't just a gatekeeping exercise; it creates a competitive moat, ensuring only legitimate brand owners can tap into this level of market intelligence.
Because this data is exclusive, it gives you a strategic edge. You can make informed decisions based on real shopper behavior, while competitors who aren't brand registered are left in the dark.
This is where you move beyond assumptions. ABA lets you build a strategy grounded in what shoppers actually do, not what you think they do. This is the foundation for fine-tuning everything from your product listings to your advertising campaigns with surgical precision.
The real magic of Amazon Brand Analytics isn't just in the data itself—it's in translating those insights into real-world business decisions that drive results.
Ultimately, using ABA is about shifting from a reactive to a proactive business model. You can spot market trends before they become obvious, identify growth opportunities before your competitors do, and build a more resilient brand on the world’s biggest ecommerce stage.
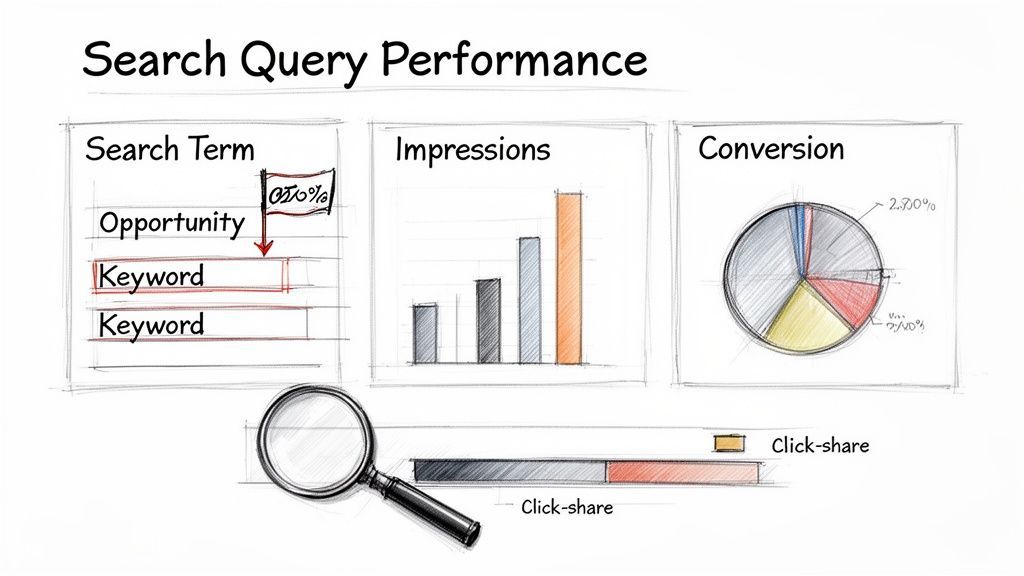
If Amazon Brand Analytics is your strategic map, then the Search Query Performance dashboard is your high-powered telescope. It lets you zoom in on exactly what customers are thinking and doing when they search. This report is a goldmine because it doesn't just show you which keywords lead to your listings—it reveals exactly how your brand stacks up against the entire market for those specific queries.
Think of it as a weekly performance review for every single keyword that matters to your products. It's built to answer the tough questions: "Are shoppers seeing my product but scrolling right past it?" or "Which search terms are secretly driving a ton of sales?" This is where raw data becomes a powerful strategic weapon.
To get the most out of this dashboard, you need to understand the language it speaks. The metrics here tell the full story of a customer's journey, from the moment they type in a search to the second they click "Buy Now."
Let's break down the essential data points you'll see:
When you look at these metrics together, you can diagnose the health of your listings at every stage of the sales funnel. For instance, tons of impressions but hardly any clicks? That almost always points to a problem with your main image, title, or price.
Key Takeaway: The Search Query Performance dashboard doesn't just hand you numbers; it tells you a story. It pinpoints where you're winning the fight for customer attention and, more importantly, where you're losing it.
Understanding the metrics is half the battle; using them to grow your sales is the other. The real magic of this report is its ability to flag clear, actionable opportunities to get ahead.
This dashboard is a game-changer for understanding exactly how customers find you, showing you vital metrics for brand-specific queries and broad category terms. In competitive niches, this data reveals your brand's true share of voice. For a high-volume keyword with millions of monthly searches, top brands might gobble up 40-50% of all clicks, while others are left fighting for scraps under 10%.
Historical data shows that a focused effort on optimizing for your top-performing search queries can boost organic visibility by up to 35%. It's all about capitalizing on what already works. You can read more about how Amazon helps sellers with brand analytics directly on their blog.
The data here clearly maps out your brand’s performance funnel—from impressions to clicks, cart adds, and finally purchases—for each keyword. Crucially, it also benchmarks your click share against the total clicks available for that term, showing you exactly how much of the pie you're getting.
The dashboard makes it incredibly easy to see where you're crushing it and where competitors are eating your lunch. By sorting the data, you can uncover different strategic angles.
Identify High-Conversion, Low-Visibility Keywords: Hunt for queries where your brand has a fantastic purchase rate but very few impressions. These are your proven winners that just need more eyeballs. The clear next step is to increase your PPC bids on these exact terms to capture more of that high-converting traffic.
Find High-Impression, Low-Click Keywords: If a keyword gets your product thousands of impressions but almost no clicks, it's a massive red flag. This tells you that you're showing up in the right searches, but shoppers are choosing someone else. It's time to A/B test your main image, sharpen your title for clarity, and double-check that your price is competitive.
Discover Emerging Search Trends: Keep a close eye on new search queries that start popping up in your report. These can signal shifts in customer needs or market behavior, giving you a golden opportunity to optimize for them before your competitors even know what's happening.
By making a habit of diving into the Search Query Performance dashboard, you stop making guesses about your keyword strategy and start making precise, data-backed decisions that have a direct impact on your bottom line.
Getting that first sale is a great start, but the real magic happens when a one-time buyer becomes a repeat customer. This is where sustainable growth comes from, and Amazon's Repeat Purchase Behavior report is your secret weapon for tracking it. It gives you a clear window into which of your products are creating genuine loyalty.
This report helps you shift your focus from single transactions to long-term customer value. It answers the one question every brand owner should be asking: "Is my product good enough that people will come back for more?" By seeing exactly which products are getting reordered, you can double down on your winners and diagnose problems with the ones that aren't making the cut.
The Repeat Purchase Behavior report is refreshingly simple but incredibly powerful. It breaks down the orders and sales for each of your products (or your entire brand) within a set period.
Here’s the data you’ll be working with:
From this, you can easily calculate your repeat purchase rate—the percentage of your customers who are returning. This single metric is a direct reflection of how satisfied your customers are and how loyal they are to your brand.
Key Insight: A high repeat purchase rate is one of the strongest indicators of product-market fit. It's solid proof that your product delivers on its promise and has earned a permanent spot in your customers' lives, making you less dependent on the constant hunt for new buyers.
The real value here isn't just in looking at the numbers; it's about understanding the story they tell. This report gives you the insights you need to make smarter business decisions.
Imagine a supplement brand discovers one of its vitamins has a 40% repeat purchase rate. That’s a huge green light. They can immediately:
The Repeat Purchase Behavior report provides statistical gold on customer loyalty, quantifying new vs. repeat orders across your catalog. Data from 2025 shows that top-performing ASINs often achieve 30-40% repeat purchase rates, far above the platform average of 15-20% for many consumer goods. In the beauty category, brands have seen repeat rates spike to 45% when they bundle products with complements identified via Market Basket Analysis, as 71% of customers are willing to switch brands if they feel misaligned—underscoring loyalty's critical role. You can explore more data on how Brand Analytics drives growth at ecombrainly.com.
On the flip side, this report is an invaluable early-warning system. If you sell a consumable product—like coffee, skincare, or pet food—that should have customers coming back but doesn't, that’s a major red flag. Something is off.
A low repeat rate for a consumable could point to a few different issues:
By catching these underperforming products early, you can dig into the root cause. Start reading customer reviews, scope out your competitors, and refine your messaging before a small problem hurts your brand’s reputation and bottom line.
If the Search Query Performance dashboard tells you what customers are searching for, the Demographics and Market Basket reports tell you exactly who they are and how they shop. These tools are the difference between a generic marketing persona and a detailed, data-backed portrait of your real customer base.
Instead of just guessing your audience is "women, aged 25-40," you can finally confirm it with Amazon's own aggregated, anonymous data. This is how you stop casting a wide, expensive net and start tailoring your creative, messaging, and even product features to the people most likely to buy.
The Demographics report in Amazon Brand Analytics is a direct window into the core characteristics of your buyers. It breaks down your customers across several key attributes, painting a clear picture of your primary audience.
This report pulls together aggregated data on:
Imagine you sell high-end, organic baby formula. The Demographics report might reveal that your core customer isn't just "new moms," but specifically "married women aged 30-39 with a college degree and a household income over $100,000." That single insight changes everything. It influences the imagery in your A+ Content, the targeting for your Sponsored Display ads, and your entire brand voice.
The Market Basket Analysis report is one of the most powerful—and weirdly underused—tools in Brand Analytics. It reveals the other products customers purchase at the same time as yours. Think of it as Amazon giving you a peek inside your customer's digital shopping cart.
This insight is pure gold for finding bundling and cross-selling opportunities. For example, a brand selling premium coffee beans might discover that 28% of their customers also buy a specific brand of oat milk or a popular pour-over coffee filter in the same transaction.
This isn't just a fun fact; it's a strategic roadmap. It tells you exactly what complementary products your customers already want, removing all the guesswork from creating bundles that boost your average order value (AOV).
Demographics and Market Basket Analysis deliver rich, aggregated customer profiles that sharpen your entire strategy. For major US markets, recent data shows 65% of shoppers are in the 25-44 age range, with 40% having household incomes of $75K or more. In categories like beauty, sales are often driven by female buyers with a college education, while electronics can skew heavily male in the 30-50 age bracket. Using these insights correctly has been shown to boost ad personalization and ROAS. You can uncover more data-driven strategies about Amazon Brand Analytics on sarasanalytics.com.
Translating these data points into concrete actions is what separates the top brands from everyone else. Here’s how you can turn demographic knowledge into a real-world advantage.
Demographic Insight
Actionable Strategy Example
Your primary buyers are 18-24 years old with a lower household income.
Action: Adjust your A+ Content to feature younger models and user-generated content (UGC). Emphasize value and affordability in your ad copy and bullet points.
A large segment of your customers has a household income of $150,000+.
Action: Focus your messaging on premium quality, unique features, and brand story. Use high-end lifestyle imagery that reflects an aspirational buyer.
Data shows a strong skew towards male buyers for your fitness product.
Action: Tailor your ad creative, videos, and product photography to appeal directly to a male audience, focusing on performance, durability, and results.
Many customers are married, according to the report.
Action: Frame your product as a solution for families or a great gift for a spouse. Create ad campaigns targeting life events like anniversaries or holidays.
By consistently checking these reports, you can make sure your brand's messaging never goes stale. You’ll be able to spot shifts in your customer base, adapt your creative to new trends, and build a brand that feels like it truly gets its audience.
Data without a plan is just noise. After digging into the individual reports inside Amazon Brand Analytics, this is where we connect the dots and turn insights into action. A growth playbook isn't some rigid document you create once and forget; it's a dynamic set of strategies you can deploy to solve specific business problems, all guided by the data you've gathered.
Think of each ABA report as a different instrument in an orchestra. The Search Query Performance report is your violin section, playing the melody of what customers are looking for. Market Basket Analysis is the rhythm section, revealing how different products work together. Your playbook is the conductor's score—it brings all the instruments together to create a powerful performance.
Launching a new product on Amazon can feel like shouting into the void. But with Brand Analytics, you can stop guessing and start executing a calculated, data-backed strategy that gives your product the best possible chance to succeed from day one.
Here’s a step-by-step thought process:
Find Your Keyword Beachhead: Before you even launch, jump into the Search Query Performance dashboard and analyze keywords related to your competitors' products. You're looking for high-volume search terms where the top-clicked ASINs have a relatively low conversion share. This signals a gap—shoppers are looking, but they aren't totally satisfied with what they're finding. These are your initial keyword targets.
Define Your Target Audience: Next, pull up the Demographics report for a similar product in your catalog (or a close competitor's, if you can). This tells you who is already buying products like yours. Is it high-income individuals aged 35-44? This insight immediately informs your launch campaign’s imagery, ad copy, and targeting.
Identify Smart Bundling Opportunities: Now, dive into the Market Basket Analysis report for related items. If you're launching a new yoga mat, what are customers frequently buying alongside other mats? Maybe it's a specific type of yoga block or a cleaning spray. This gives you a clear, data-backed opportunity to create a launch bundle that drives up your average order value right out of the gate.
This visualization shows how customer demographics and their shopping cart habits come together to paint a complete picture.
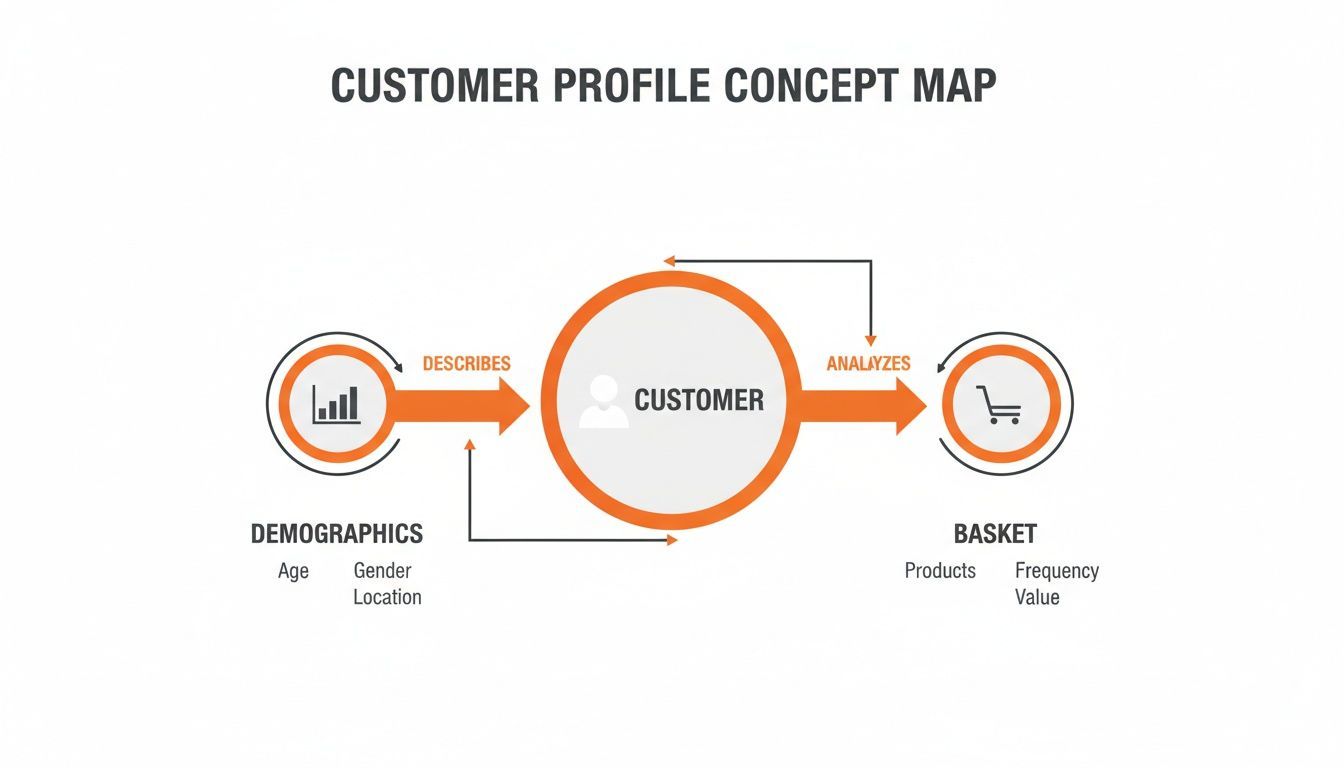
The map makes it clear: understanding who your customer is (Demographics) and what else they buy (Basket Analysis) are two essential, interconnected pieces for strategic growth.
Every brand has that one product that started strong but has since flatlined. Instead of giving up on it, you can use Amazon Brand Analytics as a diagnostic tool to breathe new life into it. The goal here is to pinpoint why sales have stalled and take targeted action.
By combining different data streams, you create a holistic view of the problem. A stagnant product rarely has a single cause; it's usually a combination of factors that ABA helps you uncover.
Here’s how to tackle this challenge:
Diagnose the Loyalty Problem: Your first stop is the Repeat Purchase Behavior report. If you have a consumable or an accessory with a low repeat purchase rate, you might have a problem with quality, pricing, or the overall customer experience. This tells you to dig into customer reviews and competitor pricing before you spend another dollar on ads.
Uncover Fresh Keyword Opportunities: Head back to the Search Query Performance report. How has customer search behavior changed since you launched the product? You might discover new, long-tail keywords that you weren't targeting at all. Shifting your PPC budget to these fresh terms can attract a whole new wave of interested shoppers.
Analyze Competitor Incursions: Use that same report to see which competing ASINs are now stealing the click share for your product's most important historical keywords. Are their main images more compelling? Is their price point better? This analysis gives you a direct, actionable checklist of what parts of your listing need an immediate refresh.
By creating these playbooks, you transform Amazon Brand Analytics from a simple reporting tool into a proactive engine for growth. Each scenario becomes a puzzle, and ABA provides all the pieces you need to solve it.
As you get more comfortable with these workflows, you'll naturally develop a much deeper understanding of your market. This is a skill you can sharpen even further by exploring advanced SEO and analytics concepts. For those looking to go deeper, check out the resources from industry leaders like Rank Math.
Diving into Amazon Brand Analytics can bring up a lot of questions, especially when you start weaving its data into your daily strategy. We've gathered the most common queries sellers have to give you clear, straightforward answers. Think of this as your quick-start guide to using the tool with confidence.
Access to Amazon Brand Analytics isn't for everyone—it's an exclusive perk for sellers enrolled in Amazon's Brand Registry program. To get in, you need a registered and active text- or image-based trademark in the country where you want to sell.
Once your brand gets the green light from the registry, the Brand Analytics dashboards will automatically pop up in your Seller Central account, usually under the "Brands" tab. This isn't just a random gate; it's Amazon's way of ensuring that only legitimate brand owners can tap into this powerful data to grow and protect their business.
The historical data you can see depends on the report. Most reports let you look back roughly one to two years, with options to view data weekly, monthly, or quarterly.
Brand Analytics isn't built to be a deep historical archive. It's designed to give you strategic insights into recent and seasonal trends so you can make smart decisions now. It's a tool for forward momentum, not a look back at ancient history. Keep in mind that Amazon is always tweaking its tools, so data retention policies could change down the road.
Key Takeaway: Think of Brand Analytics as your compass for current strategy, not a history book. The data is most powerful when you use it to spot recent trends and inform your next moves in advertising and product strategy.
The short answer is no. You can't see direct sales figures like revenue or total units sold for specific competitor products. Amazon keeps that data anonymous to protect individual seller information.
What you can see is aggregated market insight. For example, the Search Query Performance report shows you the top three clicked ASINs for any search term, along with their click share. This tells you exactly which products are winning the most eyeballs for that keyword, but it stops short of revealing their sales numbers. It’s about understanding market share, not spying on specific balance sheets.
The data in Brand Analytics is not real-time. For most reports, the refresh cadence is weekly.
Typically, the data for a given week (Sunday through Saturday) is processed and ready for you within the next 72 hours. This schedule makes it the perfect tool for weekly or bi-weekly strategic planning—analyzing trends, tweaking campaigns, and refining your listings—rather than for making split-second decisions.
Ready to turn these powerful insights into profitable growth? The experts at Clickstera Solutions LLC specialize in using data-driven strategies to scale brands on Amazon and beyond. Let us manage the complexities of PPC, DSP, and full-funnel optimization so you can focus on your business. Schedule your free consultation today!
Talk to Clickstera and get a clear next-step plan to scale your performance marketing.