
Loading article
Loading page...

When we audit Amazon seller accounts, the biggest problem we see isn’t lack of traffic — it’s sellers making decisions without understanding what their data is actually telling them. Analytics for Amazon sellers is the process of turning ad spend, search behavior, and inventory data into decisions that directly affect revenue and profit. It’s about turning all those raw numbers—from ad spend and customer clicks to inventory levels—into a clear roadmap for growth. Think of it as your business’s GPS, guiding you past competitors and straight toward your goals.
In practice, analytics is what tells us whether a growth problem is caused by visibility, conversion, or pricing. Without that clarity, sellers often increase ad spend to fix issues that actually live on the product detail page — which is one of the fastest ways to lose margin on Amazon. We regularly see sellers spend $3,000–$5,000 per month on ads without knowing which keywords are actually profitable. Analytics is how you stop that bleed. It’s chaotic, risky, and you’ll probably end up going in circles. Success isn’t just about having a great product anymore; it’s about understanding the digital breadcrumbs your customers leave behind with every search and every click. This is where analytics for Amazon sellers becomes your most powerful tool. It transforms a complex, overwhelming environment into a field of discoverable opportunities.

During account audits, we routinely find wasted spend hidden in plain sight — keywords with high click volume but no assisted conversions, SKUs with strong traffic but weak Unit Session Percentage, or repeat buyers being underutilized in remarketing campaigns. These issues are rarely obvious without structured analysis. Imagine your business is a treasure hunt. Every single data point—every click, every search, every purchase—is a clue leading you closer to the prize: sustainable, profitable growth. Customer search terms show you what shoppers really want. Repeat purchase rates tell you who your most loyal fans are. Conversion data pinpoints exactly where you’re losing potential sales in the customer journey. Without analytics, these clues are just scattered, meaningless numbers. With them, you can piece together a strategy that consistently outsmarts the competition. Top sellers use data to answer the critical questions that separate thriving brands from struggling ones:
Data provides the map, but your strategy drives the journey. Analytics bridges the gap between seeing what happened and understanding why it happened, empowering you to make proactive, profitable decisions.
This guide is designed to be your practical field manual for Amazon analytics. We’re going to move beyond abstract concepts and dive deep into the specific reports and metrics that actually matter. We’ll start with the fundamentals, building a solid understanding of foundational data sources like Seller Central and Amazon Brand Analytics. From there, we’ll explore how to turn those raw numbers into actionable strategies that get real results. This journey isn’t about becoming a data scientist; it’s about becoming a smarter, more effective seller.
Your Amazon Seller Central dashboard is the command center for your entire operation. At first glance, it can feel like stepping into an airplane cockpit—a dizzying array of dials, charts, and numbers all demanding your attention. The key isn’t to watch everything at once, but to know which instruments tell you the most about your business’s health. Think of your product listing as a physical storefront. The data inside Seller Central is what tells you what’s happening inside that store, from how many people are walking through the door to how many actually make a purchase.
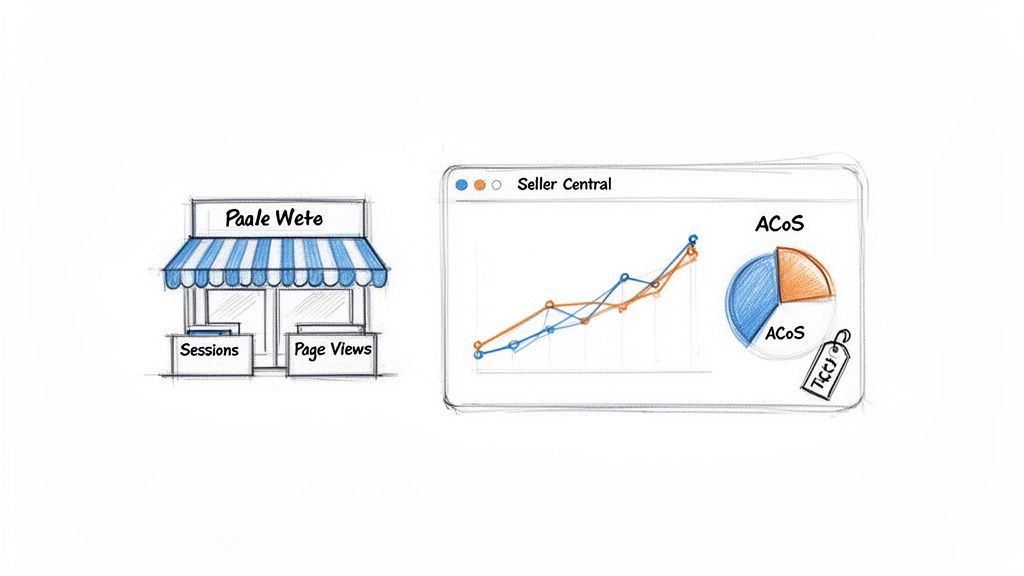
This dashboard gives you that quick, high-level view to spot sales spikes or dips, check performance over different timeframes, and keep an eye on your ad spend all in one place.
Two of the most fundamental (and frequently confused) metrics are Sessions and Page Views. Getting the difference is critical for diagnosing what’s working—and what isn’t—on your product page.
A high number of page views per session is usually a great sign. It points to an engaged shopper who is genuinely curious about your products and your brand. But if your sessions are high while your sales are flat, you’ve got a problem inside your “store”—maybe the price is off, the images are weak, or the description isn’t convincing enough to close the deal.
We use Search Query Performance reports to identify keywords where impression share is strong but click share is weak. That gap usually indicates a creative problem — main image, title, or price — not a keyword targeting issue. One of its most powerful reports is the Search Query Performance dashboard. This pulls back the curtain to show you the exact search terms shoppers are using to find your products. Even better, it shows your brand’s share of impressions and clicks for those queries, helping you spot high-opportunity keywords you might be missing in your listings or PPC campaigns. Brand Analytics also provides crucial demographic data on your buyers—their age, income, and gender. This is gold. It lets you build more targeted marketing messages and refine your entire product strategy. Considering over 50% of Amazon sellers use ads to drive traffic, this data is the secret sauce for success. With third-party sales hitting an incredible $140.05 billion in 2023, mastering these reports is how you claim your piece of the pie. You can dig deeper into the latest Amazon seller statistics on goamify.com.
Amazon Brand Analytics is like having a focus group running 24/7. It tells you what customers are thinking, how they shop, and what other products they buy, giving you a direct line into the mind of your target audience.
The Advertising Console is where a huge chunk of time and money is spent, so you absolutely have to know what the numbers mean for your bottom line. Two metrics are essential for measuring the real-world impact of your ad spend: ACoS and TACOS.
While a low ACoS is always a good goal, TACOS tells a more complete story about your business’s health. A declining TACOS over time is a fantastic sign. It means your advertising is successfully boosting your organic rank and overall brand visibility. It proves your ad dollars aren’t just buying sales today; they’re building a sustainable growth engine where ads lift your entire business, not just the products you’re promoting.In managed accounts, we often see TACOS stabilize or improve before ACoS does. Sellers who react too quickly to short-term ACoS fluctuations often undo long-term organic gains. We don’t use every tool on every account. Tool selection depends on catalog size, ad complexity, and whether the brand is optimizing for launch, scale, or margin protection. To help you keep these straight, here’s a quick-reference table of the most important metrics you’ll encounter across Amazon’s different platforms.
This table breaks down the most important metrics from different Amazon platforms, explaining what each one measures and why it’s crucial for your business.
Metric
Platform
What It Measures
Why It Matters
Sessions
Seller Central
Unique visits to your product pages in 24 hours.
Indicates how many potential customers are “walking into your store.”
Page Views
Seller Central
Total number of times your pages are viewed.
High page views per session signal strong shopper engagement.
Unit Session %
Seller Central
Your conversion rate (Units Ordered ÷ Sessions).
The single best measure of how well your listing converts traffic into sales.
Impressions
Advertising Console
How many times your ad was displayed.
The top of your advertising funnel; shows your ad’s reach.
Click-Through Rate (CTR)
Advertising Console
The percentage of shoppers who click your ad after seeing it.
Measures how compelling your ad creative and main image are.
ACoS
Advertising Console
Ad spend as a percentage of ad-driven sales.
Shows the direct profitability and efficiency of a specific ad campaign.
TACOS
Advertising Console
Ad spend as a percentage of total sales.
The ultimate health metric; shows if ads are boosting organic sales.
Search Query Performance
Brand Analytics
Your brand’s impression and click share for specific keywords.
Reveals what customers are searching for and where you can gain market share.
When we see high sessions with flat sales, the fix is rarely more ads — it’s almost always a listing issue, usually pricing, images, or unclear differentiation in the first three bullets. Understanding these metrics is the first step. The real magic happens when you start connecting the dots between them—seeing how a change in your ad CTR impacts your Unit Session Percentage, or how improving your keyword targeting lowers your TACOS. That’s when you stop just looking at data and start making profitable decisions.
While Amazon’s own dashboards give you a solid starting point, the most successful sellers know the real magic happens when you look beyond them. Amazon’s tools are great for telling you what’s happening inside your own little bubble, but they leave some massive blind spots. Third-party analytics tools are like putting on a new pair of glasses—suddenly, the entire market landscape comes into focus. Think of Seller Central like the dashboard in your car. It shows your speed, your fuel level, and warns you if the engine is overheating. It’s essential, but it’s not the whole story. Third-party tools are like adding a top-of-the-line GPS with live traffic data and market intelligence. They show you where the jams are, what routes your competitors are taking, and can even predict roadblocks before you hit them. This is the kind of information you need to plot a faster, smarter course to your destination. These platforms are designed to fill the data gaps that Amazon leaves wide open, especially when it comes to things like historical keyword data, deep competitor insights, and a true picture of your profitability.
The world of third-party analytics for Amazon sellers isn’t as complicated as it sounds. It really breaks down into a few key types of tools, each built to solve a specific problem. These platforms aren’t just about giving you more charts and graphs; they’re about handing you actionable data you simply can’t get anywhere else.
Product and Keyword Research Tools: Platforms like Jungle Scout and Helium 10 are non-negotiable for understanding market demand. They unlock historical search volume, sales estimates for competing products, and keyword difficulty scores—all crucial for validating a new product idea or finding an untapped niche.
PPC Management and Optimization Software: The Advertising Console gets the job done, but specialized PPC tools bring serious firepower. They offer advanced automation, smarter bid management algorithms, and performance analytics that help you optimize your ad spend with a level of precision that’s nearly impossible to achieve by hand.
Business Intelligence and Profitability Dashboards: These tools plug directly into your Seller Central account to give you a single, unified view of your business’s financial health. They automatically calculate your real net profit after factoring in all of Amazon’s complicated fees, ad spend, and your cost of goods sold—a calculation that is a nightmare to do accurately using Amazon’s reports alone. Most sellers dramatically overestimate profit until fees, returns, and advertising are viewed together. This is usually where the biggest mindset shift happens during onboarding.
We typically validate attribution data against branded search trends inside Amazon. If off-Amazon traffic is working, branded impressions and direct conversions increase within weeks.
Here’s a look at the Jungle Scout interface, a popular tool for product and keyword research. This dashboard shows how these tools pull together complex data like revenue, profit margins, and PPC spend into one clean, easy-to-digest view.
The biggest win from using external platforms is their ability to pull data from multiple places. A truly next-level strategy involves blending your Amazon data with insights from your other marketing efforts, like Google Ads, Meta campaigns, or even your off-Amazon blog. You might even find that improving your website’s SEO has a surprisingly positive ripple effect on your Amazon sales. If you want to get a better handle on that, you might like this comprehensive guide to SEO from RankMath. This integrated approach helps you build a complete picture of the customer journey. You can start to answer the big questions: How do my Facebook ads influence branded searches on Amazon? Is my YouTube content actually driving people to add my product to their cart? Connecting these dots turns your marketing from a bunch of separate activities into a cohesive, measurable growth engine.
By blending on-Amazon and off-Amazon data, you stop just managing a sales channel and start building a powerful brand that captures customers wherever they hang out online.
This wider perspective is more critical than ever. In Q3 2025, third-party sellers accounted for a mind-boggling 62% of all sales on Amazon. The competition is fierce, and winning requires a sophisticated game plan. For instance, tools that provide historical search volume allow for much more precise inventory planning—a huge advantage when 60% of sellers say rising costs are their biggest headache. With the full analytics stack, you can fine-tune your Sponsored Products ads, which already pull in impressive 9-10% conversion rates, to grab an even bigger piece of the pie. You can find more insights about the Amazon marketplace on amzprep.com. Ultimately, these tools give you the power to make smarter, more profitable decisions across your entire business—not just your Amazon listings.
Your Amazon sales don’t just magically happen. A customer might see your brand on Instagram, read a blog review, or click a Google Ad long before they ever hit your product page. Relying only on Seller Central data is like trying to understand a movie by watching the last scene—you see the ending, but you have no idea how the story got there. This is where connecting your off-Amazon marketing to your on-Amazon sales becomes a game-changer. It’s all about answering the million-dollar question: Is my external marketing actually driving sales? Without that connection, your marketing budget is running on hope, not data. You’re spending money on Facebook ads and influencers, but you can’t prove the return on investment (ROI). Integrating tools like Google Analytics 4 (GA4) with Amazon Attribution finally lets you see the complete picture, from the first touchpoint to the final purchase.
Think of Amazon as a walled garden. It gives you tons of data about what happens inside its walls but keeps you in the dark about how people arrived in the first place. This is where Amazon Attribution and GA4 become essential partners in your analytics for Amazon sellers strategy. Amazon Attribution is Amazon’s tool for creating special tracking links (attribution tags) for your external marketing campaigns. When a shopper clicks one of these links—from a Facebook ad, an email, or a blog post—and later buys your product, Attribution credits that sale back to the exact campaign. Here’s a simple breakdown of how it works:
This simple process turns your marketing from a blind expense into a measurable growth driver.
While Amazon Attribution tells you which external campaigns are driving sales, Google Analytics 4 (GA4) helps you understand the behavior of that traffic before it even gets to Amazon. By sending data from your website or landing pages to GA4, you can see how users interact with your brand in your own ecosystem. You can find out more by exploring these helpful resources from Google. This screenshot from a GA4 dashboard shows how you can visualize user acquisition from different channels. In this view, you can dig into traffic sources, user engagement, and conversion events, giving you a complete view of your audience’s behavior across platforms.
Combining Amazon Attribution with GA4 gives you a powerful, full-funnel view. GA4 shows you how people engage with your brand content, and Attribution proves that this engagement leads directly to Amazon sales.
This complete picture is what enables truly strategic decisions. For instance, you might find that visitors from your blog spend more time on your site and have a higher add-to-cart rate on Amazon than traffic from social media ads. That insight tells you to invest more in content marketing because it attracts higher-quality, more engaged buyers. By connecting these dots, you finally get the ability to accurately measure the ROI of your entire marketing ecosystem. You can confidently put your budget into the channels that deliver real, profitable results on Amazon and build a more efficient, sustainable business.
Data is useless without action. Staring at dashboards might feel productive, but the real value of analytics for Amazon sellers only clicks when you turn those numbers into profitable decisions. It’s the difference between a weather app telling you it might rain and you actually remembering to grab an umbrella. This section gives you a clear, repeatable framework to turn your data into a powerful growth engine. Think of it as a simple cycle: set a goal, gather the right info, analyze it for clues, form a testable idea, and then measure what happens. This process pulls you out of the guessing game and builds a system for constant improvement.
This is a simplified version of a situation we’ve encountered multiple times in competitive home and kitchen categories. Let’s walk through a practical example. Imagine you run a successful brand selling premium coffee makers. Out of nowhere, your sales for a top-performing ASIN drop by 20% week-over-week. Panic starts to set in, but instead of making random changes, you follow a plan.
Your analysis points to a clear hypothesis: the new competitor launched with a more compelling offer, and shoppers are choosing them over you. To test this, you check out their product page. Sure enough, they’ve got a killer video in their image block showing off a unique feature, and their price is slightly lower. This data gives you a targeted action plan:
This systematic approach turned a crisis into a strategic win and taught you a valuable lesson about the market. The process is perfectly captured in the customer tracking flow below, showing how off-Amazon efforts can drive measurable sales.
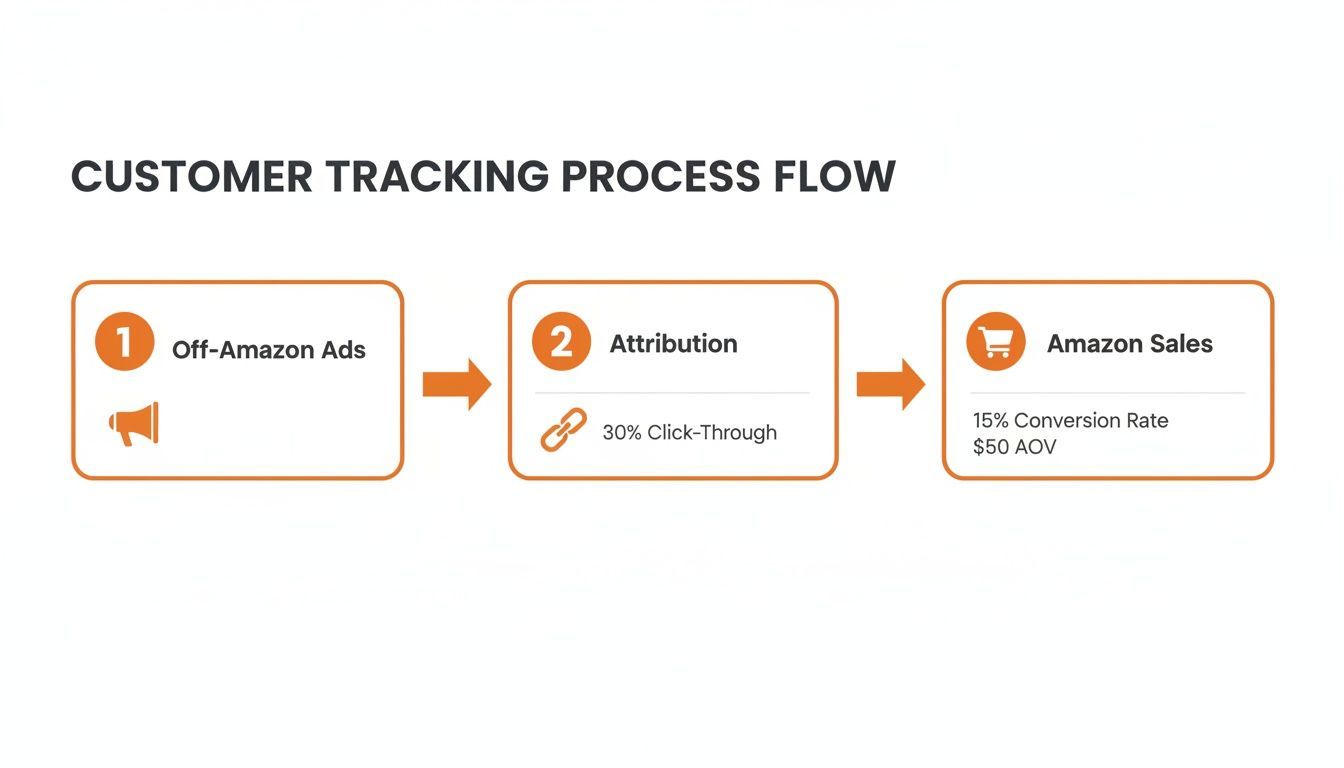
This visual breaks down how attribution links external ads directly to Amazon sales, giving you a clear path to measure your return on investment.
This isn’t a one-and-done fix; it’s a continuous loop for optimizing every part of your Amazon business. Prime members, who spend 2.5 times more than non-members, are the lifeblood of the marketplace. And with 80% of shoppers influenced by reviews, understanding what your customers are saying is vital. You can find more insights about Amazon’s growth and seller tools on aboutamazon.com. Upcoming AI enhancements in 2025, like Custom Analytics dashboards, will allow for even deeper demographic segmentation, helping you pinpoint and cater to your most valuable repeat customers.
Your action plan is the bridge between data and profit. It ensures every insight from your analytics leads to a deliberate, measurable step toward improving your business performance.
By adopting this framework, you move from being reactive to proactive. You’ll be ready to spot trends, counter competitive threats, and systematically improve every aspect of your operation. For brands seeking expert help, working with a team that holds an Amazon Verified Partner badge ensures you’re partnering with a qualified expert. This disciplined approach is how top sellers consistently stay ahead of the curve.
Diving into Amazon analytics can feel like learning a new language. To help you get fluent faster, here are some straightforward answers to the most common questions we hear from sellers. Think of this as your quick-reference guide to putting data to work.
If you could only track one metric to gauge the health of your entire business, it should be Total Advertising Cost of Sale (TACOS). It’s the single best indicator of whether your brand is growing profitably and sustainably on Amazon. Most sellers are familiar with ACoS (Advertising Cost of Sale), which just measures ad spend against ad-generated sales. TACOS goes much deeper by measuring your total ad spend against your total revenue—including organic sales.
TACOS = Total Ad Spend ÷ Total Sales
Why does this matter so much? A declining TACOS is proof that your advertising is creating a flywheel effect. It shows your ad spend isn’t just generating immediate sales; it’s also boosting your organic rank, improving brand visibility, and driving more efficient, long-term growth. A low ACoS is a sign of a good campaign, but a healthy TACOS is the sign of a healthy business.
There’s no one-size-fits-all answer here. The right frequency depends entirely on what you’re looking at and how fast you can act on it. Drowning in data every day is just as bad as ignoring it for a month. A tiered approach works best.
Yes, you can—and you absolutely should. This is exactly what Amazon Attribution was built for. It finally closes the loop between your off-Amazon marketing efforts (like Facebook ads, Google Ads, or email campaigns) and the sales they drive on the platform. It works by letting you create special tracking links, or attribution tags, for each of your external campaigns. When a shopper clicks one of those links and ends up buying your product on Amazon, that sale gets credited back to the original source. This gives you the hard data you need to see the true ROI of your off-Amazon ad spend. Instead of guessing which channels are driving customers, you can see exactly what’s working and optimize your entire marketing budget for maximum profit.
Even with access to great data, it’s easy to fall into a few common traps. Knowing what they are is the first step to avoiding them and building a truly data-driven business. Here are the three mistakes we see most often:
Avoiding these mistakes will transform your analytics from a source of confusion into your most powerful tool for making smart, profitable decisions that move your business forward.
Ready to stop guessing and start growing with a data-driven strategy? The team at Clickstera Solutions LLC combines expert knowledge with advanced analytics to scale brands on Amazon and beyond. As an Amazon Verified Partner, we build and execute full-funnel strategies that turn insights into measurable profit. Schedule a free consultation with us today and discover how we can help you win bigger results.
Talk to Clickstera and get a clear next-step plan to scale your performance marketing.