
Loading performance story
Loading page...
Maximum Slim had been running Amazon ads for over a year before we took over. Spending heavily. Getting some results. And silently bleeding margin on every single order — without knowing it. This is the two-year story of rebuilding a brand from the listing level up.
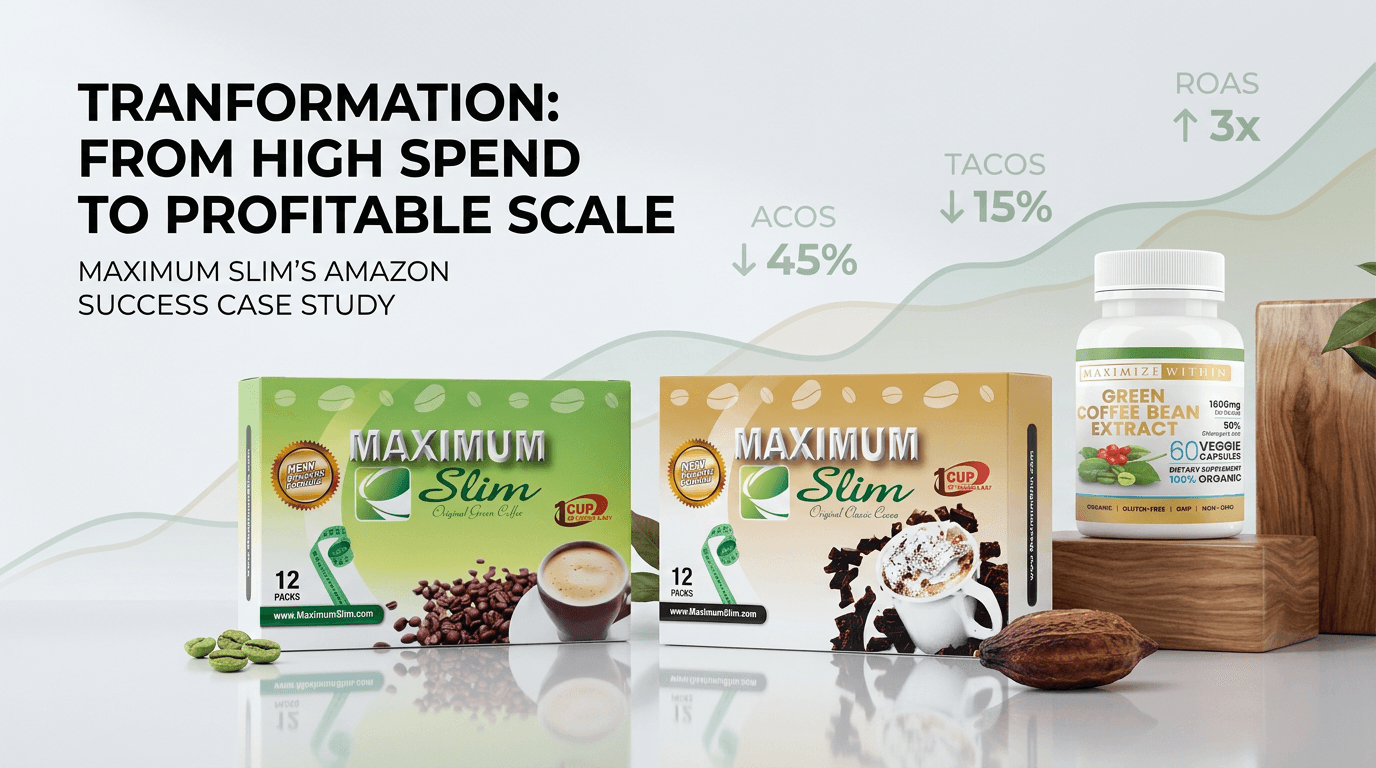
Maximum Slim is a health and wellness brand selling natural weight-management products — green coffee blends, detox teas, and supplement kits — on Amazon USA and Canada. The brand is built around clean formulations and accessible wellness, targeting a category where thousands of competitors fight for the same shelf space and the same keywords every single day.
Carlton, the founder and CEO, had been running Amazon ads for over a year before Clickstera came in. Sales were coming in. The brand was visible. On paper, things didn’t look broken. In reality, the business was structurally unsustainable — and Carlton didn’t yet have the advertising data to understand how much margin was disappearing into every sale.
When he first connected with us, he held a belief that’s surprisingly common among founders managing Amazon themselves: “You only sell as much as you spend.” The idea that ad spend was the primary lever for revenue — and that pulling back meant losing sales — had kept him locked in a high-spend, low-return cycle for more than a year before we arrived.
When we first told him we could make his advertising RoAS-positive — meaning the revenue generated by ads would exceed what he was paying for them, including fees — he thought it was impossible. He’d never seen it. He wasn’t resistant; he just genuinely couldn’t picture it yet. He agreed to let us try.
Today, Carlton doesn’t just manage Amazon US with Clickstera. He’s handed us Amazon Canada, Amazon UK, Walmart, Google Ads, and Meta Advertising. Six channels, across three years. That’s what the results built.
When we ran the first audit in early 2023, the headline number stopped us immediately. TACoS above 80%. That means for every dollar of total revenue the brand was generating on Amazon — including organic sales — more than 80 cents was going back to Amazon in ad spend. The brand was effectively working to fund Amazon’s advertising business, not its own.
But the TACoS wasn’t the cause. It was the symptom. The real causes were layered underneath, and fixing them would require going much further than campaign optimization.
“The first thing I thought when I saw that TACoS was: this brand doesn’t have an ads problem. It has a foundation problem. The ads were just exposing how broken everything underneath them was.”
The audit uncovered three layers of dysfunction — each one compounding the others:
Layer 1 — The listings were broken. Product images were poor quality. Titles were missing critical keywords. Bullet points were weak or absent. There was no A+ content, no brand story, no product video. The brand was paying to drive traffic to pages that couldn’t convert it. Every click was expensive, and every click was wasted.
Layer 2 — The campaigns had no architecture. Multiple products were bundled into the same campaigns with no ASIN-level separation. Auto campaigns were running without negative keyword lists. Spend was cannibalizing across products internally. There was no way to identify which products or keywords were actually profitable — because the data was too polluted to read clearly.
Layer 3 — The business didn’t have revenue visibility. Carlton had been running the account for over a year without the framework to understand what was actually happening to his margins. This wasn’t a criticism — it’s the natural state for founders managing complex marketplace operations without specialized support. But it meant the problems had been compounding, unchecked, for eighteen months before we arrived.
One product tells the whole story. The Maximum Slim Vitality supplement was generating around ~$3,000/month in sales when we inherited it. No description. No A+ content. No optimized imagery. No video. Just a bare listing collecting whatever accidental traffic came its way.
We rebuilt everything: keyword-rich title, structured bullet points, full A+ content with brand story and benefit hierarchy, and updated product imagery. No significant change to ad spend on this product. Pure listing quality improvement.
* Approximate figures. This single product’s growth represents a 3–4× revenue lift driven entirely by listing quality — not additional ad spend. The same methodology was applied across the full catalog.
Most agencies would have started with bid optimization. We started with the listings — because we knew that any improvement in campaign efficiency would be limited by the conversion rate of the pages we were sending traffic to. Fix the destination first. Then fix the path to it.
We built the first two or three A+ content pages ourselves, working directly inside the account. Then we did something most agencies don’t: we taught Carlton’s team how to do it. Walked them through the keyword hierarchy, the benefit-led copy structure, the image sequencing logic. Once the team understood the framework, they rolled it out across every remaining SKU themselves. This wasn’t us protecting a deliverable — it was us building capability inside the client’s business. That kind of partnership is why three years later, Carlton keeps expanding the scope.
The campaign rebuild happened in layers — what we internally call the spider web strategy. Not a single dramatic restructure, but a methodical expansion outward: identify the core, stabilize it, understand its behavior, then extend one strand at a time until the whole web is built. It takes longer. It’s less exciting to report on in week three. But the web is strong — and it scales without breaking.
Numbers can be manipulated to tell almost any story — except when you compare the same month, two years apart, with no cherry-picking. October 2023 versus October 2025 is the clearest possible window into what two years of structured work actually produces.
Ad spend fell by nearly half. Ad sales nearly doubled. Total sales grew by more than 55%. Every metric moved in the right direction simultaneously — which only happens when the underlying system has genuinely improved, not just been optimized temporarily.
| Metric | Oct 2023 | Oct 2025 | Change |
|---|---|---|---|
| Monthly Ad Spend* | ~$11,200 | ~$6,300 | ↓ ~44% |
| Ad-Attributed Sales* | ~$6,400 | ~$11,900 | ↑ ~87% |
| Total Monthly Sales* | ~$41,900 | ~$65,000 | ↑ ~55% |
| Ad Spend as % of Total Sales | ~27% | ~10% | ↓ 17 pts |
December is the highest-stakes month in e-commerce. Three consecutive Decembers tell a more honest story than any cherry-picked month.
* All figures approximate and directional. Exact financials not disclosed at client’s request. Canada launched Year 2 — December Year 3 reflects ~21 months of managed growth on the Canada channel.
Canada wasn’t part of the original scope. Carlton brought it to us — unprompted — after a full year of watching the US results compound. “Can we do this in Canada?” was the question. The answer was yes. And faster than the US, because the hard work was already done.
We didn’t start Canada from scratch. The listing infrastructure was already strong. The keyword architecture we’d built for US gave us a validated starting framework. The product catalog was identical. We took everything we’d learned in twelve months of US optimization and applied it to a new market from day one.
The difference was visible almost immediately. Where the US took months to stabilize before growth became consistent, Canada showed an uptick by week three. Not because Canada was easier — but because we weren’t discovering the playbook, we were executing it. By the end of year one in Canada, monthly revenue had reached ~$63K in December. By February 2026, it had climbed to ~$72K — outperforming the US channel by roughly 10%.
Canada isn’t a secondary market for Maximum Slim anymore. It’s the leading one.
The cross-marketplace transfer is one of the most underutilized levers in Amazon brand management. Most brands treat each marketplace as a separate entity requiring a separate strategy and a separate learning curve. Our approach is different: build the system once, correctly, then export it.
The Canada success also validated something important about the US work: it wasn’t luck or timing. The same approach, applied consistently in a different market, produced the same pattern of results — only faster. That’s not coincidence. That’s system.
Walmart was added to the scope alongside the US engagement. Starting from a ~$2–3K/month baseline in 2023, the channel now generates ~$9K/month on approximately $1,500 in monthly ad spend as of early 2026. The same structural approach — ASIN-level separation, keyword isolation, spend concentrated on proven terms — translated directly.
Remember Carlton’s first reaction — that making advertising RoAS-positive was impossible? That belief didn’t survive contact with the data. Month by month, the numbers showed something different. Ad spend fell. Revenue grew. TACoS declined. Organic ranking climbed. The system worked, visibly, repeatedly, across two years.
By the time Carlton expanded to Canada — and then to Walmart, Google, and Meta — it wasn’t because we pitched more services. It was because the trust had been built one result at a time, and expanding the scope was simply the obvious next step.
Core channel. TACoS ~20%. Revenue growing every year since takeover.
Results from week 3. Now outperforming US by ~10% monthly.
~$2K → ~$9K/month. Same structural playbook, flat ad spend.
International expansion added as the brand scaled globally.
Search and shopping campaigns capturing intent beyond Amazon.
Full-funnel social campaigns for awareness and retargeting at scale.
[Client quote from Carlton to be added — verbal feedback throughout the engagement has been consistently strong, with Carlton regularly noting the transparency of reporting and the depth of strategic thinking as key differentiators from previous management.]
If your TACoS is stubbornly high, your listings haven’t been touched in months, or you’re spending more each quarter just to maintain the same revenue — we know exactly what to look for.
Get a Free Account Audit